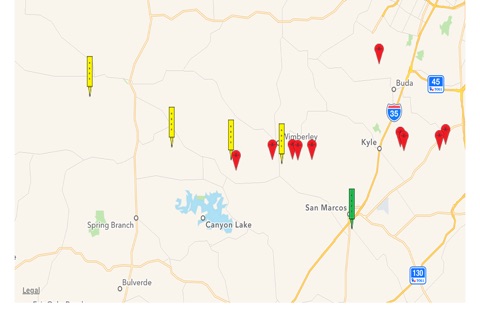

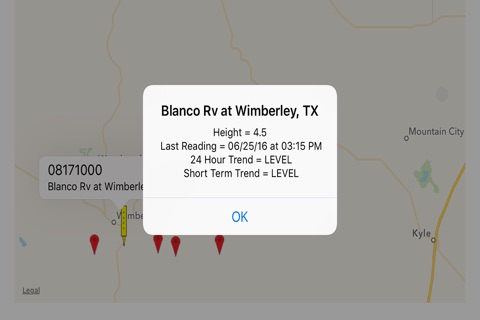

BlancoWatch uses data from USGS flood gauges on the Blanco River to show on a map the trend in gauge measurements. Green gauge pins indicate a fall in water level. Red pins indicate a rise in water level. Yellow pins indicate no change over a period of time. BlancoWatch also utilizes data from ATXfloods to show closed low water crossings in Hays County.
Be aware that BlancoWatch provides a representation of data and that the actual conditions may be significantly different from the representation. Use common sense, be safe, and do not drive through water running over a road.